Most industrial boiler systems require soft feedwater and without this softening pre-treatment, boilers are at risk of developing hard insulating deposits that reduce the heat transfer efficiency and increase energy use. Severe deposit formation can permanently damage boiler tubes or cause dangerous failures from overheating.
Water softening is an ion exchange technique used for removing calcium and magnesium ions that form hard water scale such as calcium and magnesium carbonate. The process involves exchanging source water calcium and magnesium cations for sodium cations that have been adsorbed onto resin beads filled with exchange sites. As water flows through the softener system, sodium ions are released (exchanged) from the resin, and the hard water ions are collected on the exchange sites.
When a softener with new (or regenerated) resin is placed in service, sodium ions adsorbed on the exchange sites within the resin are immediately exchanged with calcium and magnesium cations. This produces soft water with very little residual hardness in the effluent water. The resin bed will continue to exchange its sodium ions with calcium and magnesium to a point where the exchange sites are reduced, and hard water can be detected in the softener output. This is referred to as the “saturation point” and is the point at which regeneration is needed. Cation softener regeneration requires a concentrated solution of sodium chloride (salt water) to be rinsed through the resin bed; this is a physiochemical process that uses osmotic pressure and physical flow to remove the hard water ions from the resin.
The regeneration process uses at least three distinct sequences:
-
Backwash
Resin is counterflow backwashed using a specified flow rate based on water temperature and manufacturer’s specifications noted in the service manual. Using the correct flow rate is important in preventing loss of resin; if too high, the resin could be washed over to drain. Backwash serves to remove broken resin beads, dirt and debris, and reclassifies the bed for proper water flow during service. -
Brine Draw/Slow Rinse
Brine rinse is the forward flow regeneration of the resin bed using a saturated sodium chloride (NaCl) salt solution diluted to 30-38% saturation using an eductor system and fresh water. The diluted brine is eluted through the resin bed using a distributor inside the softener for even flow. The concentration of the salt through the resin bed should be above 30% saturation for a minimum of 30 minutes. -
Rinse (fast)
The rinse sequence is forward flow and uses the city water or well water to flush out the remaining salt water. This rinsing also compacts and conditions the resin and helps to prevent channeling.
Incorrect regeneration timing and improper flow rates are often the cause of problems in ion exchange water quality. An elution study is used to collect process data during the regeneration and requires graphing the concentration of salt during brine draw versus time. The information is then used to troubleshoot and evaluate the ion exchange process.
Elution Study Equipment
- 250 ml graduated cylinder – used for collecting brine rinse samples
- 1-100% Salometer – used for measuring percent saturation of the brine rinse samples
- Stopwatch or timer app – used for timing samples and the regeneration cycle
Elution Study Setup and Sample Collection Points
- Prior to the start of the study, check the concentrated brine tank with the salometer. The sodium chloride concentration should be 90% or higher. If the concentration is below 90% the water has not had enough time to dissolve the salt or there is not enough salt in the brine tank. If necessary, add salt and wait until the concentration is above 90% prior to starting the study.
- Make certain to mark or measure the water level in the brine tank prior to start of regeneration. This can be used to calculate the volume of brine used during the process to compare and confirm the volume versus the manufacturers’ specification.
- Create a log sheet ahead of the procedure that records time in minutes and percent saturation.
- For the actual study sampling, choose a sample point after the multiport valve on the discharge pipe prior to drain for the most accurate concentration measurements. Make certain there is enough flow during the brine rinse to fill a 250 ml cylinder in less than three minutes.
Elution Study Procedure
Determining the beginning of the brine draw can sometimes be difficult to determine based on the type of softener control. The brine rinse cycle, however, always follows the backwash and is typically indicated by a drop in the discharge flow rate. Softener flow controllers are either mechanical or digital. Mechanical controllers will typically have pins that indicate the cycle position, and digital controllers may have an LED display indicating the brine draw cycle. Once the brine draw cycle starts, the sampling procedure follows:
- Sample the discharge water every three minutes by collecting the sample and placing the salometer in the cylinder. Allow the salometer to settle for a few seconds.
- Take the reading from the salometer at eye level, record the time and the percent saturation on the log sheet.
- Continue to collect samples at three-minute intervals, recording and logging the results.
- Once the salometer readings are stable at less than 2% for three consecutive measurements, record the final reading.
- Note the time the system changes from brine rinse to fast rinse and record.
- As soon as the last salometer reading is recorded, measure the level of water in the brine tank with a measuring tape and record.
Using either graph paper or a spreadsheet program like Microsoft Excel, create a graph of concentration (percent NaCl) on the Y axis and time (in minutes) on the X axis.
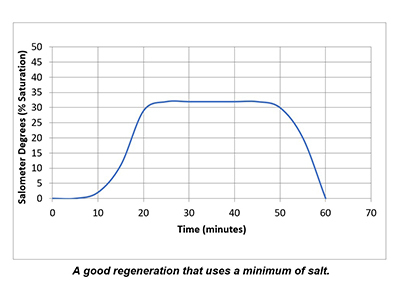
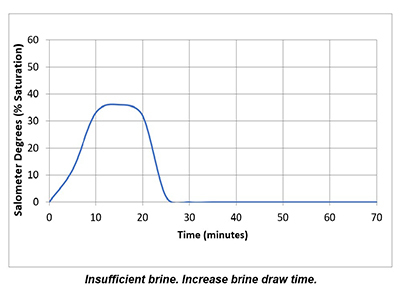
In a properly functioning regeneration cycle, the data recorded and graphed should indicate at least a 30% saturated brine solution for a minimum of 30 minutes. Higher concentration is acceptable but is wasteful if much higher than 30% or longer than 30 minutes.
Data Interpretation and Elution Curve Analysis
Plotting the data collected from the elution study and the interpretation of the results can identify irregularities and potential causes of poor softener performance. Simple review of cycle sequence timing, salometer comparisons to manufacturer data, brine tank draws down volume and review of sodium chloride use can provide further details on the softener operation. Brine draw evaluation is the first step in diagnosing a hard water excursion in a water softener. Small variations in cycle timing, flow rates or salt concentrations can have a significant impact on the softener output quality and can ultimately affect the operation costs of equipment requiring the soft water.
Mechanical Data and Calculations
Ion exchange specification data can be used for calculating performance in general terms, below are some useful formulas and mechanical information that can help compare field results with actual operation of the ion exchange equipment.
For determining resin volume in cubic feet, take an actual measurement of the resin depth in the vessel and use the following formula:
Softener Vessel Diagram
In lieu of physical measuring of the resin height and calculation consult the softener manual for resin volume.
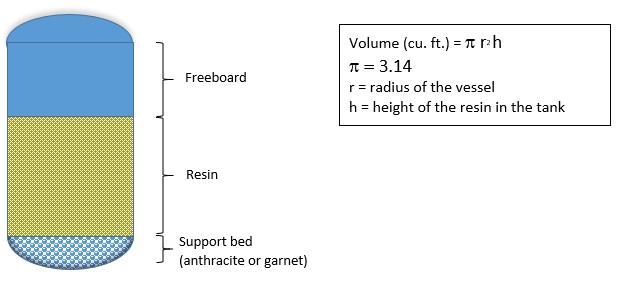
The freeboard area should allow for a 50% expansion of the resin during backflush. The softener is not completely filled with resin.
Distributors for larger softeners will have a spider web design under the resin and covered with bed support material. Small water softeners may have a different distributor design.
Typical specifications for cation resin
- Resin capacity: 22-28 kilograins/cubic foot of resin (older resin will have the lower capacity)
- Salt use (NaCl): 6-10 lbs per cubic foot of resin (8-9 lbs. is common)
- Service flow: 2-4 gpm/cubic foot of resin
- Backwash flow: 6 gpm/square foot of resin (dependent on water temperature)
- Brine draw flow: 0.5-1.0 gpm/cubic foot of resin
- Fast rinse: 1.5 – 2.5 gpm/cubic foot of resin
- Pressure drop:1 psi per linear foot of resin
 About the Author
Paul Sharpe is an industry consultant at Kurita America, specializing in boiler and cooling water. Paul has over 30 years of water treatment experience including chemical treatment formulations, sales, marketing, and technical product applications.